NEW FEATURES
SigmaPlot 12 New Features and Improvements
Known as the ‘Scientific Graphing Standard’, SigmaPlot 12 is the easy-to-use scientific graphing and statistical data analysis software package for scientists and engineers who need to create exact, publicationquality graphs that best communicates their research results for presentations, technical publications or the web. With advanced curve fitting, a vector-based programming language, macro capability and over 50 frequently use statistical tests, SigmaPlot has the analytical features necessary to extract the important information from your research data. Then with over 100 graph types and a user interface which allows detailed manipulation of every graph object you can create the exact graph to present your results.

SigmaPlot 12 has advisory statistical routines and enhances SigmaPlot into a complete statistical analysis and technical graphing suite. SigmaPlot’s award-winning interface and intuitive wizard technology guides users step-by-step through the graph creation and data analysis process. More than 300,000 researchers have used SigmaPlot because it provides the flexibility to create compelling graphs you simply can't get from a basic spreadsheet package. Users love the ability to interactively modify any small detail of the final graph to make it the perfect presentation of their data.


SigmaPlot 12 has Twelve Exciting New Features!

(1) Microsoft Office Style Ribbons

  • Context sensitive feature grouping for enhanced functionality and ease of use.
  • Expanded tooltips that include hot keys.
  • High resolution button icons.
  • Alt Key Tips provide visual display of keyboard shortcuts. >>More
(2) New Property Browser
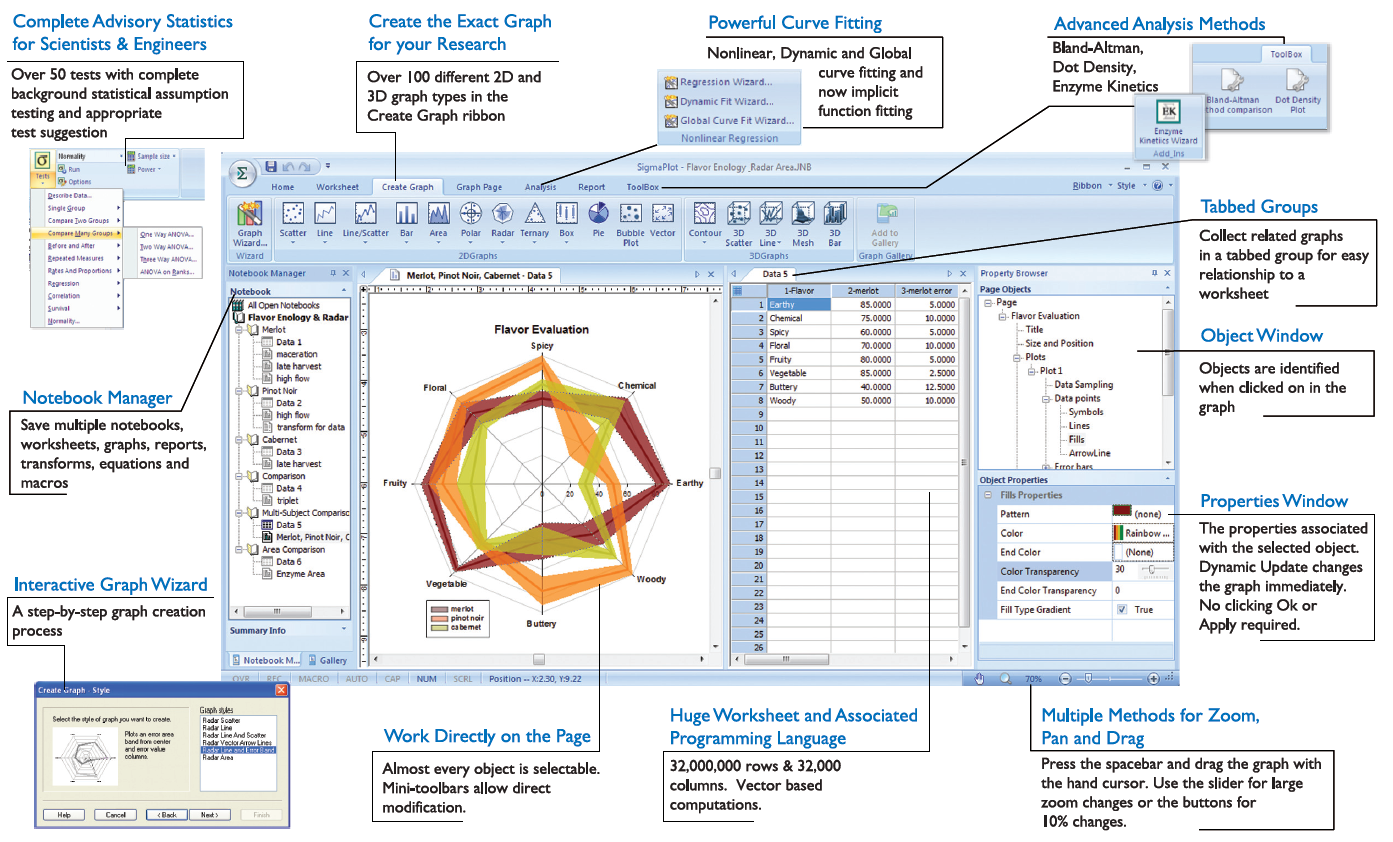
  • New graph object and property browser. Object selection in the graph is displayed in the object window and the object’s properties displayed in the property window.
  • Dynamic Update provides immediate graph redraw with property change. No "Ok" or "Apply" button click required.
  • Property group styles may be copied and applied across like groups thus simplifying property specification.
  • New window show/hide buttons for improved window real-estate management.>> More

(3) User Interface Improvement

  • New tabbed window views enables quick window management (selection, closing, grouping)
  • New docking panel guides providing simple window placement. This includes the Graph Gallery, Templates, Layouts, Object and Properties windows.
  • Group open windows into tabbed groups either vertically or horizontally. This groups like windows for easier comparison and better window management.
  • Object-specific mini toolbars are displayed adjacent to selected graph, worksheet and report objects. This allows faster editing of object properties.
  • Customizable Quick Access Toolbar for frequently used user-specific controls. >> More

(4) Improved Graph Page Navigation

  • Zoom, pan, +/- controls and zoom dialog & slider always available on status bar.
  • Drag and position graphs with "hand" mouse cursor.
  • Quick window scrolling with middle mouse wheel. >> More

(5) Worksheet Improvements

  • Mini tool bar for quicker worksheet cell editing.
  • Zoom enabled worksheets.
  • Quick Transforms list in Property Browser Object Window.
  • Quicker worksheet window scrolling using mouse wheel.
  • Formatted text in worksheet cells. Text in worksheets can contain super and subscripts, Greek letters, etc. plus they can be also used within tick labels. >> More

(6) Report Improvements

  • Insert tables with pre-defined styles or customize them completely to your preference.
  • Copy/Paste tabular data bi-directionally between SigmaPlot reports and an Excel worksheets.
  • Zoom enabled report pages.
  • Vertical and horizontal rulers in graph windows.
  • Ability to change the report background color.
  • Explicit icon in Graph Output ribbon for frequently used PDF export which is enhanced with a new report engine.
  • Drag and Drop Word 2007 and Word 2010 content directly onto the report page. >> More

(7) New Curve Fitting Features

  • Weight variables may now be specified quite generally as functions of the parameters. Therefore these weights will change at each iteration. In special cases, this includes weighting by predicted values, weighting as a function of residuals (for robust regression) and weighting as a function of the parameters.
  • Parameter covariance matrix and parameter confidence intervals added to nonlinear regression reports.
  • Implicit function curve fitting gives the ability to compute predicted values that are defined implicitly by the fit model. >> More

(8) New Statistics Features

  • One Sample Signed Rank Test.
  • Deming regression allows for errors in both x and y variables – a technique used in method comparison.
  • Normal distribution comparison with graph and statistics for preliminary quality control analysis.
  • Parallel line analysis to determine if linear regression slopes and intercepts are different.
  • Bland-Altman graph and statistics for method comparison.
  • Improvements in post-hoc testing for multi-factor ANOVAs including P-values for Dunnett’s test and more accurate statistics for multiple comparisons in 3-Way ANOVA >> More

(9) New Analysis and Transform Language Features

  • Enzyme kinetics analysis module is now included with SigmaPlot 12.
  • Worksheet row and column titles may now be set from the Transform language statements.
  • New Root() and Implicit() functions for solving equations. >> More

(10) New Graphing Features

  • GDI+ support to provide enhanced graphics features.
  • Color gradients available for almost all objects including area fills and lines.
  • Anti-aliasing eliminates jagged lines.
  • New area object and line transparency features
  • Radar graph with sub-types: scatter, line, vector, area, line & error band
  • Dot histogram graph >> More

(11) Application Support Features

  • Automatic transfer of Version 12 user options during software upgrade. >> More

(12) Macro Support Features

  • Graph page measurement units specification.
  • Automatic legend state specification. >> More

MY Office : 72-3C, JALAN PUTERI 2/4, BANDAR PUTERI, 47100 PUCHONG, SELANGOR, Malaysia. Tel:+603-8063 9300 fax:+603-8063 9400
SG Office : 259, Onan Road, Singapore 424651. Tel: +65-6468 3325 Fax: +65-6764 5646