|
|

| |
|
| |
|
| |
|
| |
|
| |
|
| |
|
| |
|
| |
|
| |
|
| |
|
| |
|
| |
|
| |
|
| |
|
SYSTAT : SIGMASCAN : TableCurve2D : TableCurve3D : PeakFIT : AutoSignal |
NEW FEATURES |
|---|
SigmaPlot 12 has Twelve Exciting New Features! |
|
Curve Fitting Weight Variables may now be Specified Generally Weight variables in the curve fitter may now be specified quite generally as functions of the parameters. These weights will change at each iteration of the curve fitter which was not the case in previous versions. As special cases this general specification includes the three new data weighting features:
Weighting by the predicted values is known to result in better curve fit statistics. Robust regression will tend to ignore outlying data values and result in a better fit to the non-outlying data. Some scientists perform replicate measurements to determine what the measurement error distribution is and then create a weighting function. They can then incorporate these errors in the curve fit by using this predetermined weighting function. Parameter covariance matrix and confidence intervals added to nonlinear regression reports Two statistics have been added to the nonlinear regression report: 1) parameter confidence intervals and 2) the parameter covariance matrix. Both can be used to obtain estimates of the error in the parameters of a curve fit.
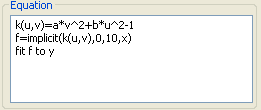
Implicit Function Curve Fitting Implicit() can be very useful in curve fitting functions where the equation you want to fit is implicit. An example of this occurs in drug synergy problems where the use of one drug causes the second drug to have a more potent effect. The equations for a simple implicit function curve fit are shown below.
(8) New Statistics Features |
SIGMAPLOT RESOURCES : Upgrade Comparison : SigmaPlot REVIEWS : SigmaPlot Supports : SigmaPlot FAQ : Technical Graphing Workshop |
