|
|
| |
|
| |
|
| |
|
| |
|
| |
|
| |
|
| |
|
| |
|
| |
|
| |
|
| |
|
| |
|
| |
|
| |
|
SYSTAT : SIGMASCAN : TableCurve2D : TableCurve3D : PeakFIT : AutoSignal |
NEW FEATURES |
|---|
SigmaPlot 12 has Twelve Exciting New Features! |
|
(8) New statistics Features One-Sample Signed Rank test This is a new statistic which determines whether the median of a data set is significantly different from a user-specified value. It is used when you want to compare some data to a fixed value and you know the data is not normally distributed. The prior existing parametric one sample t-test is used to determine if the mean value in a column of data was significantly different from a single value entered by the user. Deming Regression Deming regression allows for errors in both X and Y variables – a technique for method comparison where the X data is from one method and the y data the other. The Deming regression method basically extends the normal linear regression, where the X values are considered to be error-free, to the case where both X and Y (both methods) have error. Hypotheses can then be tested, slope different from 1.0 for example, to determine if the methods are the same. For example, it might be used to compare two instruments designed to measure the same substance or to compare two algorithmic methods of detecting tumors in images. The graph compares the two methods to determine if they are different or the same. A report shown below gives statistical results.
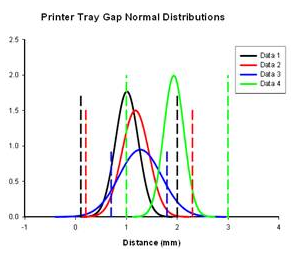
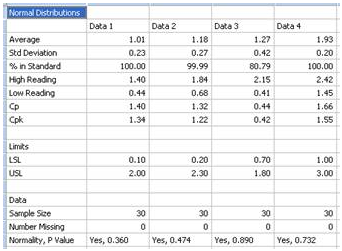
Normal distribution comparison For a preliminary quality control analysis the engineer might collect data and quickly look at it assuming it is normally distributed. SigmaPlot generates normal distribution curves for each data set using the mean and standard deviation of the data. By examining the mean and variance (and other statistics) the engineer can quickly determine if a problem exists. The analysis in SigmaPlot produces a graph for visual interpretation and a report for numerical examination. The graph and report for printer tray gap measurements in the four tray corners is shown below. The normal distributions are compared to the limit lines also graphed and to each other. The data statistics are shown in the report.
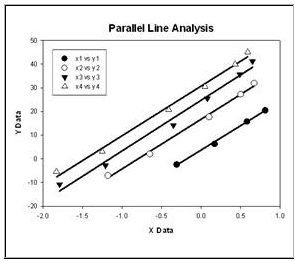
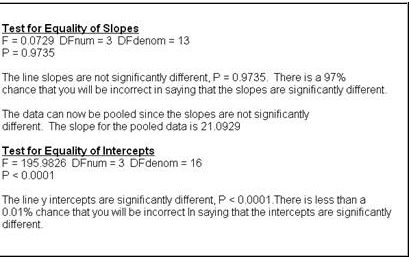
Parallel line analysis Parallel line analysis determines if linear regression slopes and intercepts of multiple data sets are significantly different. It is commonly used in the biosciences to determine relative potency (EC50), bioassays for specific coagulation factors and inflammatory lymphokines and for radioimmunoassays for prostaglandins. In the example below the slopes are not different (P > 0.05) but the intercepts are (P < 0.0001). The report is written to describe the results in understandable language.
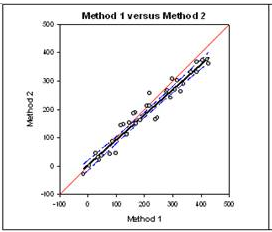
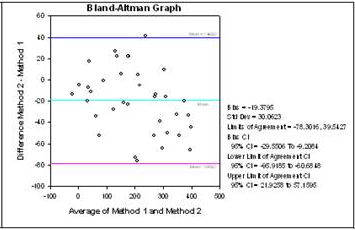
Bland-Altman method comparison technique The Bland-Altman graph and statistics is another approach to method comparison. The Bland-Altman method is a plot that shows the difference between the two methods and computes the 95% limits of agreement. If the difference between the limits of agreement is small then the two methods agree and are considered to be the same. The graph on the left directly compares the results of measurements using both methods. The graph on the right plots the difference Y-X versus the mean (Y+X)/2 and uses the limits of agreement technique developed by Bland and Altman to determine if the two methods are the same.
Improvements in post-hoc testing in ANOVA The P value for Dunnett's test has been added. It is not found in some statistics programs but is now in SigmaPlot. The computation of multiple comparisons in 3 Way ANOVA has been improved to provide increased accuracy. (9) New Analysis and Transform Language Features |
SIGMAPLOT RESOURCES : Upgrade Comparison : SigmaPlot REVIEWS : SigmaPlot Supports : SigmaPlot FAQ : Technical Graphing Workshop |