Known as the Scientific Graphing Standard, SigmaPlot 15 is the easy-to-use scientific graphing and
statistical data analysis software package for scientists and engineers who need to create exact, publicationquality
graphs that best communicates their research results for presentations, technical publications or the
web. With advanced curve fitting, a vector-based programming language, macro capability and over 50
frequently use statistical tests, SigmaPlot has the analytical features necessary to extract the important
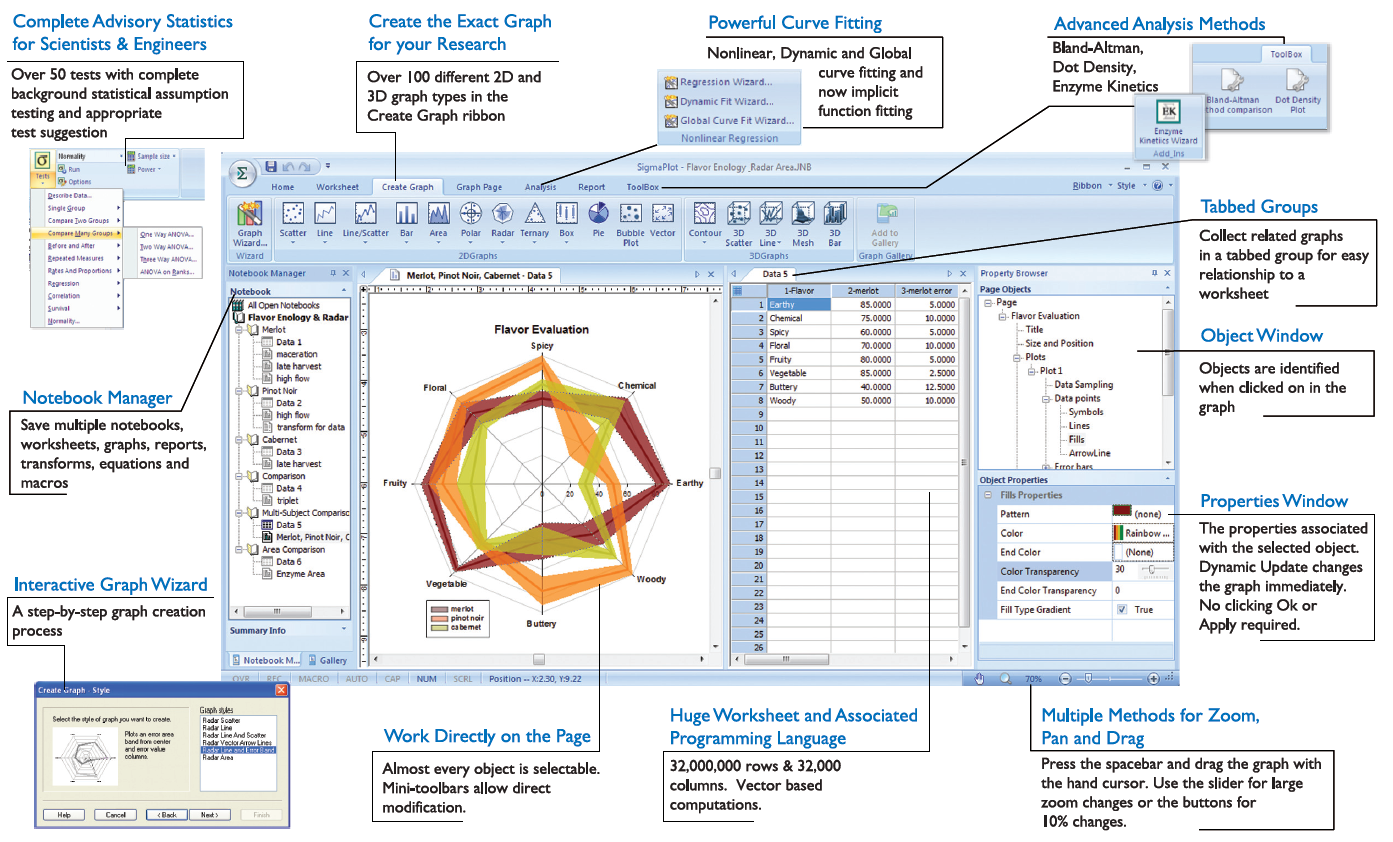
information from your research data. Then with over 100 graph types and a user interface which allows
detailed manipulation of every graph object you can create the exact graph to present your results.
SigmaPlot 15 has advisory statistical routines and enhances SigmaPlot into a complete statistical analysis
and technical graphing suite. SigmaPlots award-winning interface and intuitive wizard technology guides
users step-by-step through the graph creation and data analysis process. More than 300,000 researchers
have used SigmaPlot because it provides the flexibility to create compelling graphs you simply can't get
from a basic spreadsheet package. Users love the ability to interactively modify any small detail of the final
graph to make it the perfect presentation of their data.
Below are some of the many new features in SigmaPlot Version 14:
New Graph Features
Arrows with solid arrowheads
Added a right mouse menu command for pasting copied graph primitives (arrow, box, etc.) on the page
A common operation on a graph is to zoom in, make a modification and then zoom out. A toggle was added, Ctrl+3, between your current zoom level and 100%.
Data sampling dropdown now shows the maximum number of rows in the column
Mini-toolbars for left mouse selection may be turned off
An Anti-aliasing button has been added to the Graph Page Tab, Format Group
Improved user interface for the Color Schemes dialog
The “Each Curve” option is automatically turned on when performing a linear regression on one plot
Additional Plot Regression Statistics
Improved access to result graphs following statistical analysis – obtained by right clicking either a statistical report or another result graph
The scatter matrix graph, used to display results of some statistical tests such as correlation, has increased support from 10 variables previously up to 40 variables
Graph Properties can now be obtained by right clicking a graph or plot
Renamed the Linear Regression command in the Graph Analysis group of the Analysis tab to Plot Regression
Text and special symbols options are now shown directly on the symbols dialog
The Graph Additions Group Name has been changed to Manage Plots
Multiple Result Graph Types May Now Be Simultaneously Selected from the Create Result Graph Dialog
The default appearance of all Result Graphs has been improved
Added TIFF gray scale export option for graphs and graph pages
A Page Templates button has been added to the Format group of the Graph Page ribbon tab
New Worksheet Features
Sorting data in the worksheet now supports multiple key columns
Coefficient of Variation and 90% Confidence Interval added to Column Statistics
Formatted text can now be used in statistical analyses
Custom Column Statistics Items and Order May Now be Specified
Statistical procedures may now use data from over 4000 worksheet columns
New Analysis Features
The One-Way Frequency Tables method has been added
The unpaired (aka 2-independent samples) t-test has been enhanced to provide options to test the equality of the populations means of the two groups without assuming equal variances (Welch’s t-test)
Ctrl-A now selects all program lines in user defined transforms
More nonlinear regression application examples have been added that can now be accessed from the Help menu
Improvements to the transforms examples that can now be accessed from the Help menu
Improvements to some ape (automatic parameter estimate) functions in the Transform Language
The number of groups for computing dummy variables has been extended from 100 to 1000
Increased the maximum character length of labels in statistical tables from 30 to 255
Error Message and Partial Save Nonlinear Regression Improvements
The User-Defined Transform and Regression Dialogs are Now Resizable and can be Saved
Improved User Interface for the Quick Transforms dialog
New Miscellaneous Features
Unicode is now supported
Automatic Updating is available within SigmaPlot to get the latest updates to features
User settings are now preserved for new versions of SigmaPlot
Added new ribbon layouts for different types of workflows
The Export button is also on the Main button
New Macro Method for Exporting any Graph Page Selection
Added a Save All command to the Main Button
Two New Macros Using Indexed Data for Graphing
Sample Data Sets Available from Help
New Macro Automation Method to Determine a Worksheet Column Length
Added File Import and Import Database to the Main Button panel for more visible access