|
|

| |
|
| |
|
| |
|
| |
|
| |
|
| |
|
| |
|
| |
|
| |
|
| |
|
| |
|
| |
|
| |
|
| |
|
SYSTAT : SIGMASCAN : TableCurve2D : TableCurve3D : PeakFIT : AutoSignal |
SCW REVIEW OF SIGMAPLOT 11 |
|---|
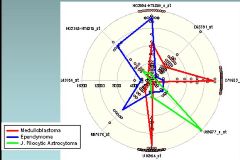
Paradoxically, one of the biggest stories is not strictly about SigmaPlot at all, but about SigmaStat. SigmaStat, one of the easiest to use statistics packages around, is very widely popular with scientists. A quick and very superficial trawl has just netted me more than a thousand peer-reviewed research papers, published in the past 12 months, which cite it as the software used for their data analysis. It has, in the past, always been a stablemate of SigmaPlot, with interaction between them when installed. Now, though still available as a standalone package, it has also been imported, wholesale, into its graphics sibling as a replacement for SigmaPlot’s own facilities. This brings considerably extended analytical reach within the same interface as the illustrative and presentation functions. The resulting 'SigmaPlot Statistics' offers a good range of descriptives, tests (including a useful spread of repeated measures), fits (including dynamic nonlinear regression), transforms (including eight new probability functions across three forms), and an optional question-and-answer-based advisory wizard to assist in selection of the most appropriate methods. The dynamic curve fitting tool, which selects the best fit obtained from multiple models across multiple parameter ranges, is impressive, while a sophisticated global curve fitter simultaneously marshals selectively shared parameters across multiple data sets to give improved fit accuracy in many cases. Back on the graphics front where SigmaPlot’s main business lies, vector plots have arrived and can, in common with other options, be overlaid and fine tuned in a flexible variety of ways. Representation can be in either point to point Cartesian start and end form or as an argument and magnitude centred on a (x,y) data point. A bit of experimentation with multivariate vector data allowed the two forms to be combined, with change in effect modelled as separate polar forms in different colours at either end of every transit – not recommended with high density sampling, but usefully informative if applied to sparse or fractional sets. Angular units, magnitude scaling (via worksheet transforms), arrowhead detail, and colour, are all selectable and changeable at will. Customisation of output is a principal characteristic of SigmaPlot, and continues to develop well. An interesting addition is optional filling in of the gaps in broken lines with a secondary colour. This is not something to over use, but two separate but closely intertwined curves, for example, gain considerably in clarity and coherence if given a suitable infill. Selection of objects in a 3D plot, which used to be less carefree than in 2D, is much improved. Aspects not covered here include, among others, plot confidence intervals, mean and range charts, contour superimposition, the upgrade of metafiles to 32-bit, preformatting of datasheets, and optionally self updating quick transforms saved with the data sheet. There are also general interface and housekeeping developments such as database and Excel 2007 file import, macro bridged plotting of Access data, Vista compatibility, a new look with user-editable toolbars, and so on. Taken together, this is the most significant upgrade for some time; after a period of consolidation, SigmaPlot has a firm new direction to follow. |

SIGMAPLOT RESOURCES : Upgrade Comparison : SigmaPlot REVIEWS : SigmaPlot Supports : SigmaPlot FAQ : Technical Graphing Workshop |