|
|

| |
|
| |
|
| |
|
| |
|
| |
|
| |
|
| |
|
| |
|
| |
|
| |
|
| |
|
| |
|
| |
|
| |
|
SYSTAT : SIGMASCAN : TableCurve2D : TableCurve3D : PeakFIT : AutoSignal |
SCI REVIEW OF SIGMAPLOT |
|---|
SigmaPlot® - Exact Graphs for Exact Science
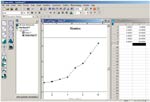
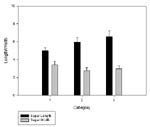
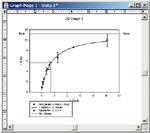
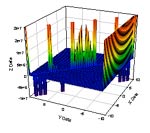
Graphics Graphics creation seems to become a bit easier with each version. The simple bar chart with error bars shown in Figure 2. took 10 seconds to create (including data import) after reading the simple tutorial. Adding more data to make a more complex bar chart, labeling the bars and adding ANOVA results to the worksheet area takes one or two minutes longer, depending upon how rapidly the user burns through the tutorial. Similar graphics for regression and curve fitting are quickly produced with error bars, drop lines, and cutoff lines (Figure 3.). The addition of axis-breaks is especially useful when graphing a variety of scientific data, as are the additions of clip art and equations, use of drawing tools, and ability to rapidly paste into PowerPoint slides. For the more complex functions, 3D graphics are available and use is made of contour, mesh, and solid graphics (Figure 4.). The equation editor facilitates instant graphics for any valid function, and these expressions can either be typed in or cut and pasted from another source. Most of the actions allow for editing and the graphs can be made (almost) as complex as necessary. The temptation is to include as much information as possible, but more advanced users will usually go for a simpler graphic that the intended audience will appreciate and understand. SigmaPlot will excel there. As seen in Figure 1, graph/chart types include scatter, line, fill, contour, polar, bar, pie, and 3D. Each type has many subgroup choices, so the chance of not finding a needed template is nil for all but the most specific use.
Special Modules : Statistics and Pharmacology When SigmaStat is purchased with SigmaPlot, the two programs are joined at the time of installation, and the full statistical power of the former is now available in the latter. This unfortunately, will increase the price of the package and decrease the use of SigmaStat as a standalone product. Still, the integration is seamless and greatly enhances the usefulness of the total package. The biologist and chemist will find the further integration of a pharmacology module from previous versions to be especially useful. With the enclosed macro's they can do exploratory enzyme kinetics, shelf life determinations, simple ligand binding calculations from a variety of models, and standard curve analysis (straight line, quadratic, and s-shaped curve). The dialog boxes offer several variations and expedite curve analysis. For more complex formulations, the analyst can use built-in or user-defined transformations. Summary SigmaPlot 9 offers the expected improvements over earlier versions as well as a few surprises in the ease of use category. Where previously there was a struggle to quickly produce a complex graphic, the developers have addressed the learning curve and significantly decreased the slope. The main lesson learned is that when problems occur, read the manual: either paper or under the Help menu. If further support is needed, technical help is available by phone, fax, or email. The response is usually rapid and very helpful so keep this in mind when evaluating package versus price. SigmaPlot has been around for some time and it is always pleasing to see the ease-of-use issue addressed as it has been in this version. A detailed synopsis of new and useful features is available at the website, and demo versions may be easily downloaded at the same site. |
||||||||||
SIGMAPLOT RESOURCES : Upgrade Comparison : SigmaPlot REVIEWS : SigmaPlot Supports : SigmaPlot FAQ : Technical Graphing Workshop |


