|
|

| |
|
| |
|
| |
|
| |
|
| |
|
| |
|
| |
|
| |
|
| |
|
| |
|
| |
|
| |
|
| |
|
| |
|
SYSTAT : SIGMASCAN : TableCurve2D : TableCurve3D : PeakFIT : AutoSignal |
OVERVIEW 3 |
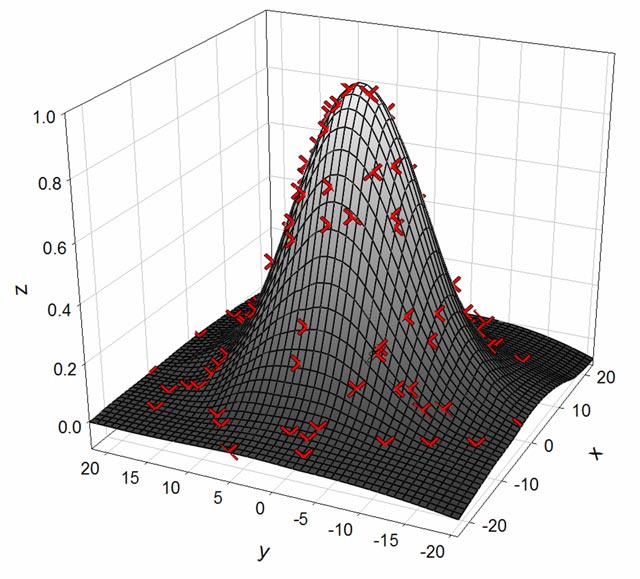
| More than 100 2-D and 3-D Technical Graph Types |
From simple 2-D scatter plots to compelling contour plots, SigmaPlot gives you the exact technical graph type you need for your demanding research. And, to help you see interactions in your 3-D data, SigmaPlot powerfully renders multiple intersecting 3-D meshes with hidden line removal. With so many different chart and graph types to choose from, you can always find the best visual representation of your data.
|
SIGMAPLOT RESOURCES : Upgrade Comparison : SigmaPlot REVIEWS : SigmaPlot Supports : SigmaPlot FAQ : Technical Graphing Workshop |