|
Course Description
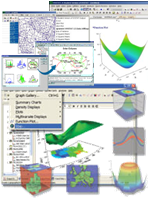
Statistical Software package like SYSTAT allows participants to carry out comprehensive analysis of univariate and multivariate data based on linear, general linear, and mixed linear models. With different types of robust regression analysis when conventional multiple regressions are not enough, you now can design experiments, carry out power analysis, do probability calculations and fit them to data sets instantly. This workshop is designed for anyone who wants to understand more of what SYSTAT can offer.
Prerequisites
- Experience with Microsoft Windows Operating System
- Basic statistical background
Duration:
1 Full Day
Content:
Understanding of Statistical Software
1. Overview of Systat
- Working with Data
- Working with Output
- Creating and Modifying Graphs
2. Descriptive Statistics
- Descriptive Statistics in SYSTAT
- Inferential Statistics
3. Hypothesis Testing
- Tests for Mean(s), Variance(s) & Correlation(s)
4. Correlations, Associations and Distance Measures
- Continuous data
- Distance Measures
- Rank order Data
- Unordered Data
Multivariate Data Analysis
5. Factor Analysis
- Principal Components, iterated principal axis, maximum likelihood
- Rotation
6. Dependence Techniques
- Regression Analysis
- Multiple Discriminant Analysis
- MANOVA
7. Cluster Analysis
Other Analysis Methods
8. Survival Analysis
- Cox Regression
- Parametric Models
9. Time Series
- Trend Analysis
- ARIMA Models
Who Should Attend:
This course will benefit researchers, scientists, engineers or anyone who would like to explore the use of SYSTAT for their statistical applications. Novice statistical user could use SYSTAT's menu driven interface to conduct simple analyses and product beautiful 2D and 3D graphics for representation and reports. Those in need of advanced analysis could use it for more sophisticated statistical routing and create plot and chars that are instantly ready for publication.
|