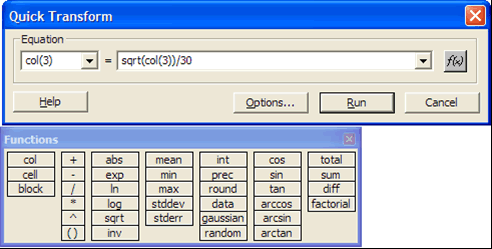
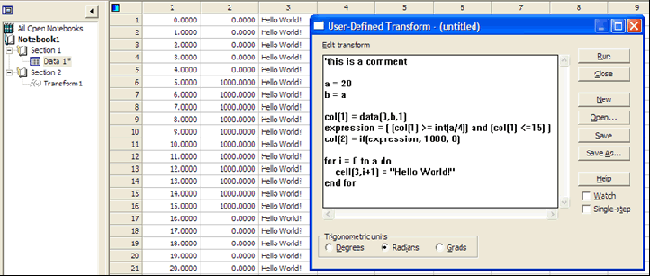
SigmaPlot comes with a simple, easy-to-use scripting language for manipulating data in an active worksheet. The scripting language can allocate memory to variables; perform looping, Boolean logic, and evaluate functions to transform a worksheet.
Worksheet transforms can be entered into either the Quick Transform dialog, or the User-Defined Transform dialog. New users will find the Quick Transform dialog to be a gradual introduction to single line transforms.

Experienced and more demanding users will find the User-Defined Transform dialog to be a powerful way to transform worksheet data. As of SigmaPlot 14, user-defined transforms can be stored as an item in a notebook along with the data.

The following list groups transforms by function type. It is followed by an alphabetical reference containing complete descriptions of all transform functions and their syntax, with examples.
|
Worksheet Functions
These worksheet functions are used to specify cells and columns from the worksheet, either to read data from the worksheet for transformation, or to specify a destination for transform results.
|
| Function |
Description |
| block |
The block function returns a specified block of cells from the worksheet. |
| block height & width |
The blockheight and blockwidth functions return a specified block of cells or block dimension from the worksheet. |
| cell |
The cell function returns a specific cell from the worksheet. |
| col |
The col function returns a worksheet column or portion of a column. |
| put into |
The put into function places variable or equation results in a worksheet column. |
| subblock |
The subblock function returns a specified block of cells from within another block. |
| |
Data Manipulation Function
The data manipulation functions are used to generate non-random data, and to sample, select, and sort data. |
| Function |
Description |
| data |
The data function generates serial data. |
| if |
The if function conditionally selects between two data sets. |
| nth |
The nth function returns an incremental sampling of data. |
| sort |
The sort function rearranges data in ascending order. |
| |
Trigonometrics Function
SigmaPlot and SigmaStat provide a complete set of trigonometric functions. |
| Function |
Description |
| arccos |
This function returns the arccosine of the specified argument. |
| arcsin |
This function returns the arcsine of the specified argument. |
| arctan |
This function returns the arctangent of the specified argument. |
| cos |
This function returns the cosine of the specified argument. |
| sin |
This function returns the sine of the specified argument. |
| tan |
This function returns the tangent of the specified argument. |
| cosh |
This function returns the hyperbolic cosine of the specified argument. |
| sinh |
This function returns the hyperbolic sine of the specified argument. |
| tanh |
This function returns the hyperbolic tangent of the specified argument. |
| |
Numeric Functions
The numeric functions perform a specific type of calculation on a number or range of numbers and returns the appropriate results. |
| Function |
Description |
| abs |
The abs function returns the absolute value. |
| exp |
The exp function returns the values for e raised to the specified numbers. |
| factorial |
The factorial function returns the factorial for each specified number. |
| mod |
The mod function returns the modulus, or remainder of division, for specified numerators and divisors. |
| In |
The ln function returns the natural logarithm for the specified numbers. |
| log |
The log function returns the base 10 logarithm for the specified numbers. |
| sqrt |
The sqrt function returns the square root for the specified numbers. |
| |
Range Functions
The following functions give information on ranges. |
| Function |
Description |
| count |
The count function returns the number of numeric values in a range. |
| missing |
The missing function returns the number of missing values and text strings in a range. |
| size |
The size function returns the number of data points in a range, including all numbers, missing values, and text strings. |
| |
Accumulation Function
The accumulation functions return values equal to the accumulated operation of the function. |
| Function |
Description |
| diff |
The diff function returns the differences of the numbers in a range. |
| sum |
The sum function returns the cumulative sum of a range of numbers. |
| total |
The total function returns the value of the total sum of a range. |
| |
Random Generation Function
The two “random” number generating functions can be used to create a series of normally or uniformly distributed numbers. |
| Function |
Description |
| gaussian |
The Gaussian function is used to generate a series of normally (Gaussian or “bell” shaped) distributed numbers with a specified mean and standard deviation. |
| random |
The random function is used to generate a series of uniformly distributed numbers within a specified range. |
| |
Precision Functions
The precision functions are used to convert numbers to whole numbers or to round off numbers. |
| Function |
Description |
| int |
The int function converts numbers to integers. |
| prec |
The prec function rounds numbers off to a specified number of significant digits. |
| round |
The round function rounds numbers off to a specified number of decimal places. |
| |
Statistical Functions
The statistical functions perform statistical calculations on a range or ranges of numbers. |
| Function |
Description |
| avg |
The avg function calculates the averages of corresponding numbers across ranges. It can be used to calculate the average across rows for worksheet columns. |
| max |
The max function returns the largest value in a range. |
| min |
The min function returns the smallest value in a range. |
| mean |
The mean function calculates the mean of a range. |
| runavg |
The runavg function produces a range of running averages. |
| stddev |
The stddev function returns the standard deviation of a range. stderr The stderr function calculates the standard error of a range. |
| avg |
The avg function calculates the averages of corresponding numbers across ranges. It can be used to calculate the average across rows for worksheet columns. |
| max |
The max function returns the largest value in a range. |
| min |
The min function returns the smallest value in a range. |
| |
Area and Distance Function
These functions can be used to calculate the areas and distances specified by X,Y coordinates. Units are based on the units used for X and Y. |
| Function |
Description |
| area |
The area function finds the area of a polygon described in X,Y coordinates. |
| distance |
The distance function calculates the distance of a line whose segments are described in X,Y coordinates. |
| partdist |
The partdist function calculates the distances from an initial X,Y coordinate to successive X,Y coordinates in a cumulative fashion. |
| |
Curve Fitting Function
These functions are designed to be used in conjunction with SigmaPlot’s nonlinear curve fitter, to allow automatic determination of initial equation parameter estimates from the source data. You can use these functions to develop your own parameter determination function by using the functions provided with the Standard Regression Equations library provided with SigmaPlot. |
| Function |
Description |
| ape |
This function is used for the polynomials, rational polynomials and other functions which can be expressed as linear functions of the parameters. A linear least squares estimation procedure is used to obtain the parameter estimates. |
| dsinp |
This function returns an estimate of the phase in radians of damped sine functions. |
| fwhm |
This function returns the x width of a peak at half the peak’s maximum value for peak shaped functions. |
| inv |
The inv function generates the inverse matrix of an invertible square matrix provided as a block. |
| lowess |
The lowess algorithm is used to smooth noisy data. “Lowess” means locally weighted regression. Each point along the smooth curve is obtained from a regression of data points close to the curve point with the closest points more heavily weighted. |
| lowpass |
The lowpass function returns smoothed y values from ranges of x and y variables, using an optional user-defined smoothing factor that uses FFT and IFFT. |
| sinp |
This function returns an estimate of the phase in radians of sinusoidal functions. |
| x25 |
This function returns the x value for the y value 25% of the distance from the minimum to the maximum of smoothed data for sigmoidal shaped functions. |
| x50 |
This function returns the x value for the y value 50% of the distance from the minimum to the maximum of smoothed data for sigmoidal shaped functions. |
| x75 |
This function returns the x value for the y value 75% of the distance from the minimum to the maximum of smoothed data for sigmoidal shaped functions. |
| xatxmax |
This function returns the x value for the maximum y in the range of y coordinates for peak shaped functions. |
| xwtr |
This function returns x75-x25 for sigmoidal shaped functions. |
| |
Miscellaneous Functions
These functions are specialized functions which perform a variety of operations. |
| Function |
Description |
| choose |
The choose function is the mathematical “n choose r” function. |
| histogram |
The histogram function generates a histogram from a range or column of data. |
| interpolate |
The interpolate function performs linear interpolation between X,Y coordinates. |
| polynomial |
The polynomial function returns results for specified independent variables for a specified polynomial equation. |
| rgbcolor |
The rgbcolor(r,g,b) color function takes arguments r,g, and b between 0 and 255 and returns color to cells in the worksheet. |
| |
Special Constructs
Transform constructs are special structures that allow more complex procedures than functions. |
| Function |
Description |
| for |
The for statement is a looping construct used for iterative processing. |
| if... then... else |
The if...then...else construct proceeds along one of two possible series of procedures based on the results of a specified condition. |
| |
Fast Fourier Transform Functions
These functions are used to remove noise from and smooth data using frequency-based filtering. |
| Function |
Description |
| fft |
The fft function finds the frequency domain representation of your data. |
| invfft |
The invfft function takes the inverse fft of the data produced by the fft to restore the data to its new filtered form. |
| real |
The real function strips the real numbers out of a range of complex numbers. |
| img |
The img function strips the imaginary numbers out of a range of complex numbers. |
| complex |
The complex function converts a block of real and/or imaginary numbers into a range of complex numbers. |
| mulcpx |
The mulcpx function multiplies two ranges of complex numbers together. |
| invcpx |
The invcpx takes the reciprocal of a range of complex numbers. |

