|
|
SIGMASTAT RESOURCES |
SYSTAT : SigmaPLOT : SIGMASCAN : TableCurve2D : TableCurve3D : PeakFIT : AutoSignal |
PRODUCT USES
The following white paper(s) highlight some application areas:
Catecholaminergic control of the electric organ discharge (EOD) in the African mormyrid Brienomyrus brachyistius
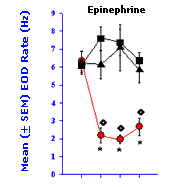
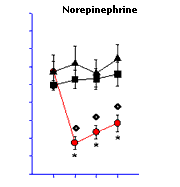
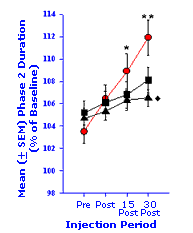
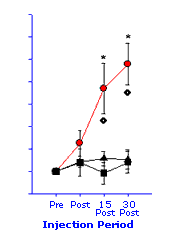
This figure describes the catecholaminergic control of the electric organ discharge (EOD) in the African mormyrid Brienomyrus brachyistius. The rate and waveform of this EOD are used in social communication. |
|
Data were plotted and statistical analyses were performed using SigmaPlot and SigmaStat, respectively.
SigmaStat Printout for the effects of epinephrine on electric organ discharge frequency (rate).
Hormone Groups:
E = Epinephrine Injected Fish
V = Vehicle Injected Fish
C = Non-Handled Control Fish
Injection Periods:
Pre = Pre-Injection Period
Post = Post-Injection Period
15-P = 15 Minutes Post-Injection Period
30-P = 30 Minutes Post-Injection Period
Two Way Repeated Measures Analysis of Variance on One Factor
Friday, January 09, 1998, 16:52:18
Balanced Design
|
|
||||||||||||||||||
The difference in the mean values among the different levels of Hormone are greater than would be expected by chance after allowing for effects of differences in InjPeriod. There is a statistically significant difference (p = 0.000187). To isolate which group(s) differ from the others use a multiple comparison procedure.
The difference in the mean values among the different levels of InjPeriod are greater than would be expected by chance after allowing for effects of differences in Hormone. There is a statistically significant difference (p = 0.022). To isolate which group(s) differ from the others use a multiple comparison procedure.
The effect of different levels of Hormone depends on what level of InjPeriod is present. There is a statistically significant interaction between Hormone and InjPeriod. (P = 0.0000000017)
Power of performed test with alpha = 0.0500: for Hormone : 0.987
Power of performed test with alpha = 0.0500: for InjPeriod : 0.855
Power of performed test with alpha = 0.0500: for Hormone x InjPeriod : 1.000
|
|||||||||||||||
|
||||||||||||||||||
|
||||||||||||||||||||||||||||||||||||||||||
1. Dr. Robert E. Landsman (Director of Scientific Research and Instructor of Biology and Psychology), Melissa Miao, Linda Perrotti, and Sheela Gupta. Academy for the Advancement of Science and Technology, 200 Hackensack Ave., Hackensack, NJ 07601


