|
|
SYSTAT : SIGMAPLOT : TableCurve2D : TableCurve3D : PeakFIT : AutoSignal |
PRODUCT USES |
|---|
MEASUREMENT OF OIL DROPLET SIZE AND DISTRIBUTION
SigmaScan Pro and TableCurve 2D were used to characterize the size distribution of oil droplets (1). SigmaScan measured the oil droplet radius and TableCurve found the Weibull function to best characterize their size distribution. Oil droplets, suspended in a fluid column were imaged using conventional CCD camera technology and a PC compatible frame grabber board. The image is shown in Figure 1.

Figure 1: Image of oil droplets suspended in a fluid column
The image was calibrated using a two point calibration from the Calibrate, Distance and Area option in the Image menu. The contrast was enhanced using the Histogram Stretch procedure (Image, Intensity menu) so that operators could better visualize the oil droplets (the Old Start line end point was dragged with the mouse to intensity 192 which stretches the light gray (192) to white (255) range over then entire 0 – 255 range). The enhanced image is shown in Figure 2.
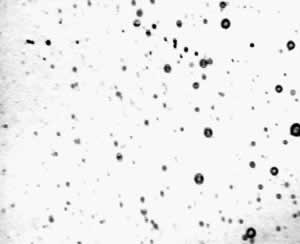
Figure 2: Image after contrast enhancement
Intensity Thresholding the image in the intensity range 0 – 140 using the Image, Threshold option selected the darker oil droplets. The selected oil droplets are shown in the red overlay plane in Figure 3.

Figure 3: Selecting the oil droplets using intensity thresholding
Due to the surface reflections, intensity thresholding will not select all pixels in some of the oil drops. The Fill Holes feature in the Image, Overlay Filters dialog was used to allow accurate droplet area measurements to be made. This fills the holes in the droplets as shown in Figure 4.

Figure 4: Using the Fill Holes procedure to eliminate open areas in the oil droplets
The objects on the red overlay plane were then counted and the parameters perimeter, area, ferret diameter, shape factor, compactness and number of pixels measured using the Measure Objects option in the Measurements menu. These measurements were selected from the list in the Measurements tab in the Measurements Settings dialog. A macro was written to compute the circular radius of each droplet using the equation R = (A/pi)^0.5 and the results placed into the worksheet. A histogram of droplet radius from 0 to 10 microns was also computed. An ASCII file report was generated and formatted in Excel.
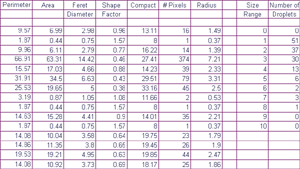
The histogram data in the last two columns was copied into TableCurve 2D. All peak functions were selected from the Custom Equation dialog and the Weibull distribution found to fit the data best. The TableCurve graph of these results is shown in Figure 5.
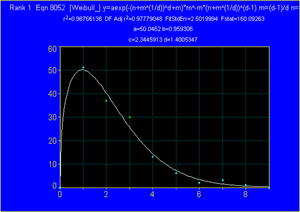
Figure 5: Distribution of oil droplet radius. The Weibull distribution provided the best fit.
1. Colin T. Sim, Labtronics, Inc.