|
|
 Graphing & Analysis |
|||||
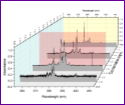
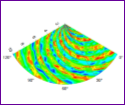
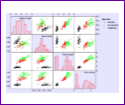
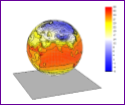
Origin is a user-friendly software application package that provides powerful data analysis and publication-quality graphing
capabilities tailored to the needs of scientists and engineers. The application offers an easy-to-use interface for beginners, and the ability for advanced users to customize analysis and graphing tasks using themes, Analysis Templates, Custom Reports, batch processing and programming. Origin graphs and analysis results can automatically update on data or parameter change, allowing you to create templates for repetitive tasks or to perform batch operations from the user interface, without the need for programming. Extend the capabilities in Origin by installing free Apps available from our website. Connect with other applications such as MATLAB™, LabVIEW™ or Microsoft© Excel, or create custom routines within Origin using our scripting and C languages, embedded Python, or the R console.
|
|||||
Origin has always been my tool for scientific plotting. After comparing various products, I found Origin is the tool which has no obvious shortcomings, and provides a large collection of great features that other products do not provide. Origin is really efficient and super powerful if users master most of the functions. More importantly, OriginLab is really willing to listen to feedback from users and keeps improving the software. I always look forward to seeing what OriginLab will offer in the next version. Renshaw Wang, PhD |
|||||
 |
 |
 |
 |
 |
 |
 |
 |
 |
 |
 |
 |
 |
 |
 |
 |
 |
 |
| 2D & 3D Graphing | Curve & Surface Fitting | Statistics Analysis | Signal Processing | ||
| Graph Gallery | Animation Gallery | 3D Function Gallery | |||
| Chemistry | Neuroscience | Pharmacology | Spectroscopy | Test & Measurement | |

