|
|
SYSTAT : SIGMAPLOT : TableCurve2D : TableCurve3D : PeakFIT : AutoSignal |
PRODUCT USES |
|---|
COLOR MEASUREMENT OF LEAF DISEASE STATES
The objective is to use color to determine the amount of necrosis, disease or elemental deficiency exhibited by leaves. SigmaScan Pro can quantify images based on color content. In this example areas of leaves with specific color ranges were measured.
Two leaves were imaged using SigmaScan Pro, a COHU Color CCD camera and the True Vision Targa Plus 16/32 frame grabber board. A 24-bit color bitmap file was created (Figure 1).
The image contains almost all colors but red, brown and yellow predominate. The image was calibrated using a 2 point calibration in the Calibrate Distance and Area dialog and the known width of the left leaf. A color threshold was performed using the Color Threshold dialog from the Image, Threshold menu.
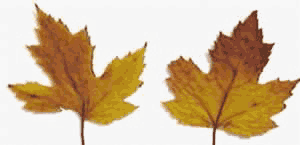
Figure 1: 24-bit color image of leaves
Click to View Larger Image
Our goal is to separate and measure the area of the leaves that are red and brown-yellow. To do this we will threshold these two ranges of the intensity histogram. The [0 to 53] threshold for the red colors is shown in Figure 2.
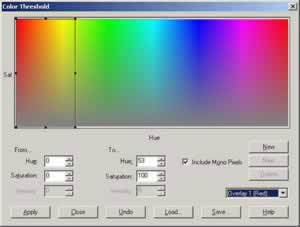
Figure 2: The threshold range for red leaf colors.
Click to View Larger Image
The threshold range for brown-yellow is shown in Figure 3.
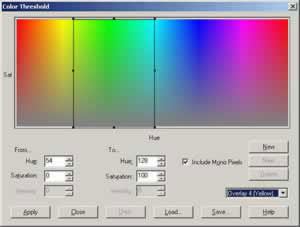
Figure 3: The threshold range for brown-yellow leaf colors
Click to View Larger Image
Applying these two threshold ranges to the leaves results in leaf areas covered by the red and yellow overlay layers for the red and brown-yellow leaf colors. These are shown in Figures 4 and 5, respectively. Note the lack of spatial overlap of the two overlay layers.
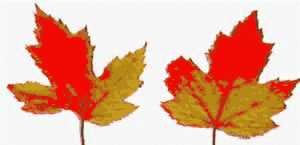
Figure 4: Area of leaves with red colors (red overlay layer)
Click to View Larger Image
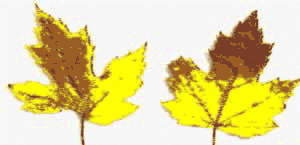
Figure 5: Area of leaves with brown-yellow colors (yellow overlay layer)
Click to View Larger Image
The areas of the leaf objects defined by color thresholding were computed using Measure Objects from the Measurements menu. These values were placed in columns 1 and 2 of the worksheet for the red and brown-yellow leaf colors, respectively. Selecting the Statistics worksheet tab computes various descriptive statistics. The total leaf areas were computed from the mean value and number of values. There were 727 red leaf objects detected with at total area of 65.4 square centimeters. In the brown-yellow leaf regions, 1127 objects were found with a total area of 78.9 square centimeters. These results are shown in Figure 6.
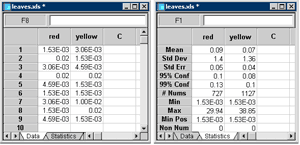
Figure 6: Results of measuring leaf areas in the red and brown-yellow leaf color regions.