|
|


Introducing SigmaPlot 11

Analyze and Graph your Data with Unparalleled Ease and Precision

SigmaPlot graphing software from SYSTAT takes you beyond simple spreadsheets to help you show off your work clearly and precisely. With SigmaPlot, you can produce high-quality graphs without spending hours in front of a computer. SigmaPlot offers seamless Microsoft Office integration, so you can easily access data from Microsoft Excel spreadsheets and present your results in Microsoft PowerPoint® presentations.

Systat Software has upgraded its data analysis and graphing software SigmaPlot and version 11 is being released.

SigmaPlot 11 will provide non-statisticians the necessary tools to create advanced statistical graphs, while fully supporting the user with an improved, broad statistical features package to analyse and present exact graphs. >> More

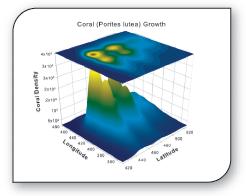
The software guides users (scientists, researchers, engineers and students) through every step of data analysis, allowing users to easily perform advanced statistical analysis. From studying genomics, cancer or heart disease to even wildlife ecology. SigmaPlot arms the user with the power to produce defensible research and create compelling publication-quality graphs for technical publications, presentations or the web.

In addition to Systat improving SigmaPlot’s graph customisation capability, the software is now fully integrated with a complete advisory statistical analysis package to provide comprehensive analysis and graphing software that takes users from raw data to publication-quality graphs. New features include:

1. A 2D Vector Plots is a display of a field of vectors in x,y coordinates where both direction and magnitude are represented.  A popup dialog box can allow the user to specify arrow properties such as color, line thickness, and arrowhead length and angle. This new feature can be used by, but not limited to physicists, climate researchers, and other fields where spatial data includes both direction and magnitude information.

2. Global Curve Fitting -  It allows users to easily setup a global curve fit. It gives users the ability to easily share one or more equation parameters across multiple data sets.

3. SigmaStat Permanently Included in SigmaPlot -  This addition will also make SigmaPlot more competitive with other products on the market such as Origin, Prism, IGOR and Excel which already had statistical analysis and technical graphing available in their base product. In addition, a new release of SigmaStat Version 4.0 will be still be available as a separate program. >> More

4. Pre-Formatted Worksheets - The user can start by selecting the type a graph that they wish to create and a worksheet will be automatically created with the data format required for that graph.  Data entered into the worksheet is immediately displayed on the graph. This feature will also demonstrate to the user the strong relationship between the data format and the graph type.

5. Automatic Updating of Quick Transforms -  Each worksheet can hold a list of user defined transforms that will automatically be re-run whenever the transform input data has changed.

6. Improved 3D Graph Customization - In SigmaPlot10, almost all objects in a 2D graph were selectable with a mouse click.  Almost all objects in a 3D graph were not. SigmaPlot11 now adds mouse selectability to all 3D graph objects.

7. New User Interface - SigmaPlot11 now enjoys an updated look and feel across the entire application. Users can also add or prune out toolbar features or functions the user decides he's going to use thereby streamlining his customized workspace.

8. Support for Enhanced Metafile Format (EMF) files are a new and improved 32-bit revision of the WMF format. EMF files have extended functionality over WMF files. SP11 now includes support for importing and exporting EMF files.

9. SigmaPlot 11 is 100% fully Vista compliant and including support for SigmaPlot help files.

10. SigmaPlot11 adds compatibility for Microsoft Office 2007 that allow import of Excel 2007 Directly. Previous versions would not import Excel 2007 files without an intermediate conversion step to a prior file version.

11. Standard Curves Macro Improvement - In addition to the EC50 value already computed, the user can also compute other user-entered values like EC40 and EC60 values instantly.  Two five-parameter logistic functions have been added and the Dynamic Curve Fitting feature included to help solve difficult curve fitting problems.

SIGMAPLOT FLYER (2 Pages)

Free trial version on CD-ROM
Test SigmaPlot 11 with your own data. Ask for a free trial version of SigmaPlot 11 on CD-ROM.

System Requirements
Hardware:

- Windows Vista:
1GHz 32-bit (x86) or 64-bit (x64) processor,
1 GB of system memory,
100 MB of available hard disk space,
CD-ROM drive,
800x600 SVGA/256 color display or better

- Windows XP or 2000:
300 megahertz (MHz) processor,
256 MB of system memory,
100 MB of available hard disk space,
CD-ROM drive,
800x600 SVGA/256 color display or better

Software:

Windows 2000, Windows XP or Windows Vista;
Internet Explorer 6 or higher;
Office 97 or higher (for Excel Integration, Paste to PowerPoint slide, Insert Graphs into Word and other macros)

Yes, I would like Solutions4U to send me additional information about this product.

Googol Technology could offer a variety of control challenges appropriate to all levels of university education and research.  Student learn by tackling real-world engineering problems using solid, high quality system, and enhance their practical skills with a thorough understanding of control theory principles.

SYSTAT offers more scientific and technical graphing options than any other desktop statistics package. Compare subgroups, overlay charts, transform coordinates, add geographic projections, change colors, symbols and more to create insightful presentations. Change graph locations, point-and-click to alter axis labels, scales, colors and symbols.


Micro-Box is a rugged, high-performance, industrial PC with no internal moving parts. The product supports all standard PC peripherals including video, mouse, and keyboard. For engineers who have real-time analysis and control systems testing needs, Micro-Box offers an excellent mix of performance, compact size, sturdiness, and I/O expandability. A selection of I/O options are available; PC/104 or PCI based AD/DA, DI/O and Counter (PWM) modules that address numerous prototyping requirements as well as support for SCI and TCP/IP. Micro-Box is integrated with MATLAB/Simulink allowing the user to conduct real-time modeling and simulation of control systems, rapid prototyping, and hardware-in-the-loop testing without the need of manual code generation and complicated debug processes. This results in significant cost savings and reduced development time.


EMECS is to provide multi-function control model experiments to carry out the procedure of Theories→ Program simulations →Controller design → Hardware implements.


“Learner’s Guide to MATLAB®” is a full day, hands-on course providing participants with a platform to learn MATLAB quickly and successfully.  Participants equipped with the knowledge of MATLAB will be able to address and solve real engineering and science issues.

“Applied Adaptive Signal Processing: Algorithms, Applications and DSP Implementation” is a two-day, hands-on course introducing participants to the application-oriented world of adaptive signal processing. Important and useful concepts on adaptive filtering are introduced, before showing the applications and implementation aspects.


A highly graphical neural network development tool that combines modular, icon-based network design interface with an implementation of advanced learning procedures and genetic optimization tools.


Revolutionize your trading strategy with TradingSolutions by combining traditional technical analysis with state-of-the-art artificial intelligence (AI) technologies.


copyright © 2008
SOLUTIONS4U MY Co REG. No: 706527A
SOLUTIONS4U SG Co REG. No: 200713296Z
ABOUT US sitemap contact us privacy policy terms & conditions