|
|

| |
|
| |
|
| |
|
| |
|
| |
|
| |
|
| |
|
| |
|
| |
|
| |
|
| |
|
| |
|
| |
|
| |
|
SYSTAT : SIGMASCAN : TableCurve2D : TableCurve3D : PeakFIT : AutoSignal |
DESKTOP ENGINEERING REVIEW OF SIGMAPLOT |
|---|
SigmaPlot Charts a New Course
In a world of mature software products, upgrades often include only a handful of major new features, but the new SigmaPlot offers dozens of new features. The programmers at Systat have been busy since the last upgrade almost three years ago. For some users the most significant new feature will be the integration with the company's SigmaStat statistics program. Other notable additions are a redesigned notebook interface, improvement in the solver, and added symbols. Program Basics SigmaPlot is primarily a tool for producing publication-quality plots of technical data-where publication is meant in the broadest sense to include not only formats suitable for a print journal but also for PowerPoint slides or for including in Web pages. Secondarily, it is an analysis tool that lets you perform some basic statistics and curve fitting on your data. SigmaPlot's strength has long been ease of use-it was the first to allow notebooks of related graphs/data sets, and it was the first scientific graphics program to provide a wizard interface for the production of graphs from data. It has a wide variety of 2D graph types-even as esoteric as bubble and box plot-and the most basic 3D types. SigmaPlot plays well with other programs. It includes a macro language licensed from Sax Software (Eugene, OR; sax.net) that is VBA-compatible and links well to other VBA macro languages. Excel support is strong-you can import Excel data or, if you prefer, open Excel worksheets from within SigmaPlot. The program's free Internet Explorer add-in that allows placing of SigmaPlot graphs on Web pages is very useful and flexible. New Feature
While SigmaPlot has gone through several acquisitions/corporate splits, it has long been associated with a company that also offers powerful statistical programs-first SigmaStat, then SPSS, and now Systat. So on one level, it is puzzling that what has been offered through SigmaPlot's Statistics Menu has been so limited. The explanation is that the corporate parent didn't want to impact sales of its full statistics package nor have to increase the price of SigmaPlot for users who didn't need the more powerful statistics. With this version, Systat has found the ideal solution-powerful statistics, including dozens of procedures such as 3-way ANOVA, are available from inside SigmaPlot but only if you also own the company's SigmaStat product. The integration is seamless with SigmaStat, which is called up in the background from SigmaPlot.
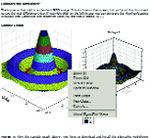
The new version has added significant import and export capabilities. Data can now be imported from ODBC-compliant databases-such databases, including Access, provide ODBC drivers for programs like SigmaPlot to use. SigmaPlot supports SQL queries in forming the import. PDF is a new export option. Here, you get to choose the color depth and resolution of the graphs produced. The 3D graphing engine has been revamped to speed up the drawing and so allow the handling of much bigger data sets. However, the set of 3D types and the customizability is still fairly basic and not as extensive as in Wolfram's Mathematica (wolfram.com) or as in OriginLab's Origin (originlab.com). There are several interface enhancements. The notebook organizer interface has been revised and now allows summary information for each section or object to be displayed. Despite the fact that Systat says the interface is more Explorer-like, it remains difficult to reorder sections and you cannot have subsections. The Regression Wizard and Histograms have been improved. There are several interface enhancements. The notebook organizer interface has been revised and now allows summary information for each section or object to be displayed. Despite the fact that Systat says the interface is more Explorer-like, it remains difficult to reorder sections and you cannot have subsections. The Regression Wizard and Histograms have been improved. Strong Points One of my favorite SigmaPlot features is its ability to save plots as HTML pages in a dual format. Others accessing a page produced with SigmaPlot will be able to see the data or zoom in on the plot if they are using Internet Explorer and have the free SigmaPlot viewer add-in. For others, the JPEG rendition will be displayed. SigmaPlot's VBA-based programming language is a pleasure to use with its user-friendly development environment. The UI for producing the basic plots and the intelligent, multitabbed dialog to customize graphs make SigmaPlot ideal for those who use a scientific graphing program infrequently. The Bottom Line There used to be about a dozen serious choices for those with graphical needs that go beyond Excel. There are now only two-SigmaPlot and Origin. In recent releases Origin addressed its user interface deficiencies so that it is an overall tie with SigmaPlot's wizards. Origin's formatting and style toolbar will be invaluable to the higher end user. For analysis and 3D needs, Origin is considerably stronger. Current users of SigmaPlot will find enough here to want to upgrade. Those choosing a new program will want to seriously consider SigmaPlot 9 if their needs are primarily for 2D graphs and they do their numerical analysis in another program. Contributing Editor Barry Simon is chairman of the math department at the California Institute of Technology. You can send him your thoughts about this article via e-mail c/o de-feedback@helmers.com. Requirements: Windows 98 or higher, 48 MB disk space, 64 MB RAM |
||||||||


SIGMAPLOT RESOURCES : Upgrade Comparison : SigmaPlot REVIEWS : SigmaPlot Supports : SigmaPlot FAQ : Technical Graphing Workshop |