|
|

| |
|
| |
|
| |
|
| |
|
| |
|
| |
|
| |
|
| |
|
| |
|
| |
|
| |
|
| |
|
| |
|
| |
|
SYSTAT : SIGMASCAN : TableCurve2D : TableCurve3D : PeakFIT : AutoSignal |
OVERVIEW 4 |
| Customize every detail of your charts and graphs |
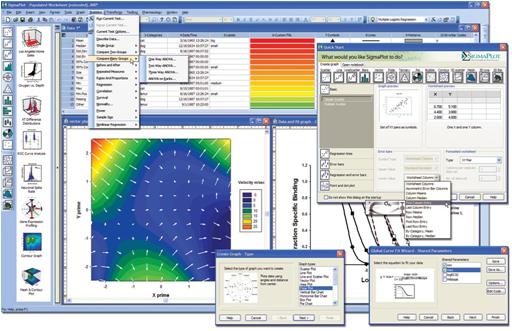
SigmaPlot offers the flexibility to customize every detail of your graph. You can add axis breaks, standard or asymmetric error bars and symbols; change colors, fonts, line thickness and more. Double-click on any graph element to launch the Graph Properties dialog box. Modify your graph, chart or diagram further by pasting an equation, symbol, map, picture, illustration or other image into your presentation. |
SIGMAPLOT RESOURCES : Upgrade Comparison : SigmaPlot REVIEWS : SigmaPlot Supports : SigmaPlot FAQ : Technical Graphing Workshop |