Click here to see the online version.
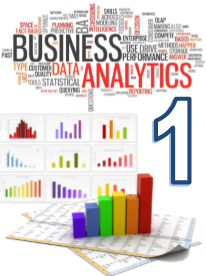 |
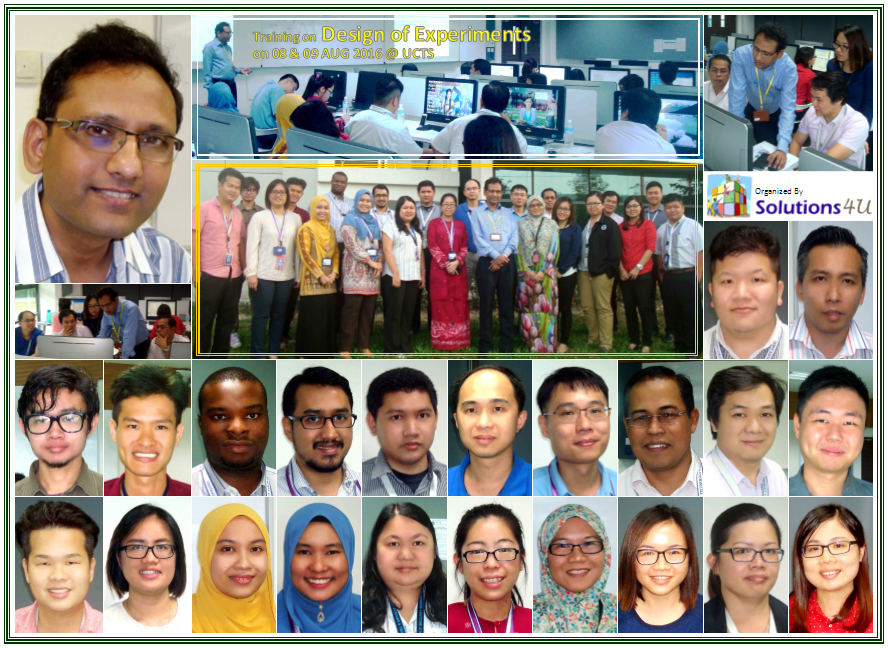
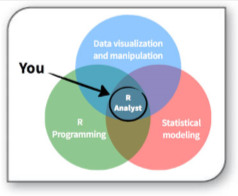
Training on Business Analytics I for Data Scientist: Uncover Data Analysis & Info visualization using R Language Solutions 4U Training Center @ Puchong |
|||
 |
 |
 |
 |
|
and decision making in a user-friendly environment ..."
This 2 day training program on Business Analytics I for Data Scientist has been designed to prepare you to become a business decision maker and fit you in the business analytics space. |
 |
 |
Course Benefit: Prerequisites |
Course Outline
- Introduction to business analytics
The program begin with an overview into the world of analytics. You will learn about the various applications of analytics, how companies are using analytics to prosper and study the analytics cycle.- What is analytics and its importance
- Analytics and current scenario
- Application of analytics
- Different kinds of analytics
(Descriptive and predictive) - Concept of machine learning
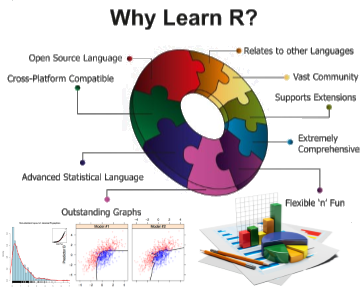
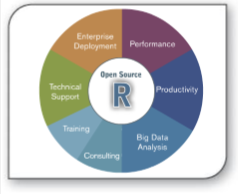
- Introduction to R
R is the most popular software/language for data management & statistical analysis of data. It is free and open source. This module is all about learning how to manage and manipulate data and datasets, the very first step of analytics. We shall teach you how to use the R language to work with various types of data.
- Installation of R & R Studio
- Understanding R environment
- Getting started with R
- Data types in R
- Variable operators in R
- Data vectors & data frames
- Reading and writing data files to R
- Statistics for business decision making
In basic statistics for business decision making, you shall learn how to start understanding your data by summarizing the data, checking its variability and shape. You will understand the concept of most fundamental statistical distribution known as normal distribution and get the exposure of concept of probability calculations on normal distribution curve.
- Data and data types
- Concept of variation
- Measures for central tendency
- Measure for variability
- Normal distribution curve
- Probability calculation using normal distribution curve
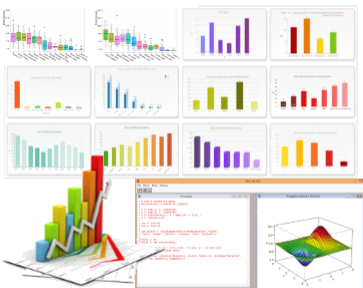
- Data visualization using graphical tools
Data visualization is extremely important to
understand what the data is saying and gain insights in just one glance. Visualization of data is a strong point of the R software and you will learn the same in this module
- Pareto diagram / Bar chart / Pie chart / Histogram / Box plot / Scatter plot
- Pareto diagram / Bar chart / Pie chart / Histogram / Box plot / Scatter plot
- Hypothesis testing and statistical tests
Creating hypothesis, statistically test it and validate it through data and present it with clear and formal numbers to support decision making.
help you taking accurate business decisions without being mis-led by seasonal and cyclical impacts.
- Principle of hypothesis testing
- Statistical tests ( 1-sample-z, 1-sample-t, 2-sample-t)
- ANOVA
- Correlation & Regression
- Business Case Studies

Who Should Attend
This course is meant for all those students and professionals who are interested in working in analytics industry and are keen to enhance their technical skills with exposure to cutting-edge practices. This is a great course for all those who are ambitious to become 'Data Analysts' in near future. This is a must learn course for professionals from Mathematics, Statistics or Economics background and interested in learning Business Analytics.
Note: Due to the nature of the course and the learning expectations, the availability seats are limited. You need to register early to obtain confirmation of your space.
 15 - 16 MAR, 2021 @ MY
Venue : Solutions 4U Training Center @ Puchong
10 % Early Registration Discount before 15 FEB
2021
10 % Group Discount for 3 or more from same organization
Sign Up Now
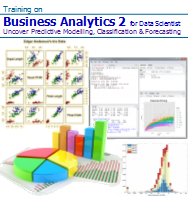
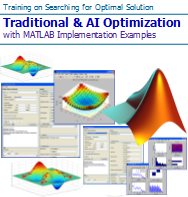
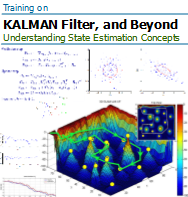
Other upcoming courses to enrich and enhance your technical computing capability and data anaysls skill-set, Just click onto the Title to find out more details.
 |
 |
 |
 |
 |
 |
 |
 |
 |
 |
 |
 |
For more information, please contact us at enquiry@solutions4u-asia.com
![]() :
:
The updates of our training program are sent to you, as we think that they might be of interest and benefit you. Please help to forward to others who may be interested. However, you may unsubscribe if you do not wish to receive further mailing from us. Thank you.